How Pinetrack works
From a shake on the train to an alert for the track team, with no one watching a screen.
- 01Sensor on the train floorRecords vibration 100 times a second plus GPS on every trip.
- 02Uploads after each runUploads over cellular after each run, automatically. For this demo, the recordings were uploaded by hand.
- 03Cleans the signalRemoves gravity, drops braking and accelerating, and adjusts for speed.
- 04Pins it to the track mapPins each second to the official track map and compares it with earlier passes in the same direction.
- 05Checks the ruleFlags a 25 m slice when it is at least 1.5× typical and elevated (top 10% for that pass) on at least 2 passes, at least 2/3 of the passes covering it. This is the exact rule behind the spots on the map.
- 06Alerts track maintenanceSends an automatic alert to the agency’s track maintenance team (email, SMS or work order) with location, evidence and suggested checks. An inspector confirms or dismisses it, and that feedback is saved. In this demo, alerts go to our team inbox.
Places worth inspecting—not diagnoses of broken rails. Vibration is compared within the selected travel direction. Locations follow a corridor reference; sensor GPS does not identify the physical track. Braking and accelerating windows are excluded.
How we measured it
About this demo: we had a very short time to ship, so we couldn’t build the Pinetrack sensor itself yet. To show how it will work, we used phones in its place: four phones rode the E Line and recorded vibration and GPS, just as the sensor will. The recordings on this page come from those phones.
Pinetrack finds places worth inspecting. It does not diagnose broken rails. Sensor vibration readings can reflect the vehicle, speed, track geometry, crossings, or other conditions. An inspector must establish the cause.
Westbound and eastbound recordings are analyzed separately. Multiple sensors on the same inferred pass contribute one combined result. A colored ribbon is an approximate corridor location, not a surveyed rail position or confirmed track assignment.
Review the recordings and calculation method
| Recording | Direction | Pass group | Start time |
|---|
Sources: CPUC: double-track Expo corridor · GTFS route geometry guidance · GPS.gov: GPS positioning limits
Each spot’s vibration trace, in its Evidence tab, comes from the second analysis below.
A second analysis: zones confirmed by repeat trains
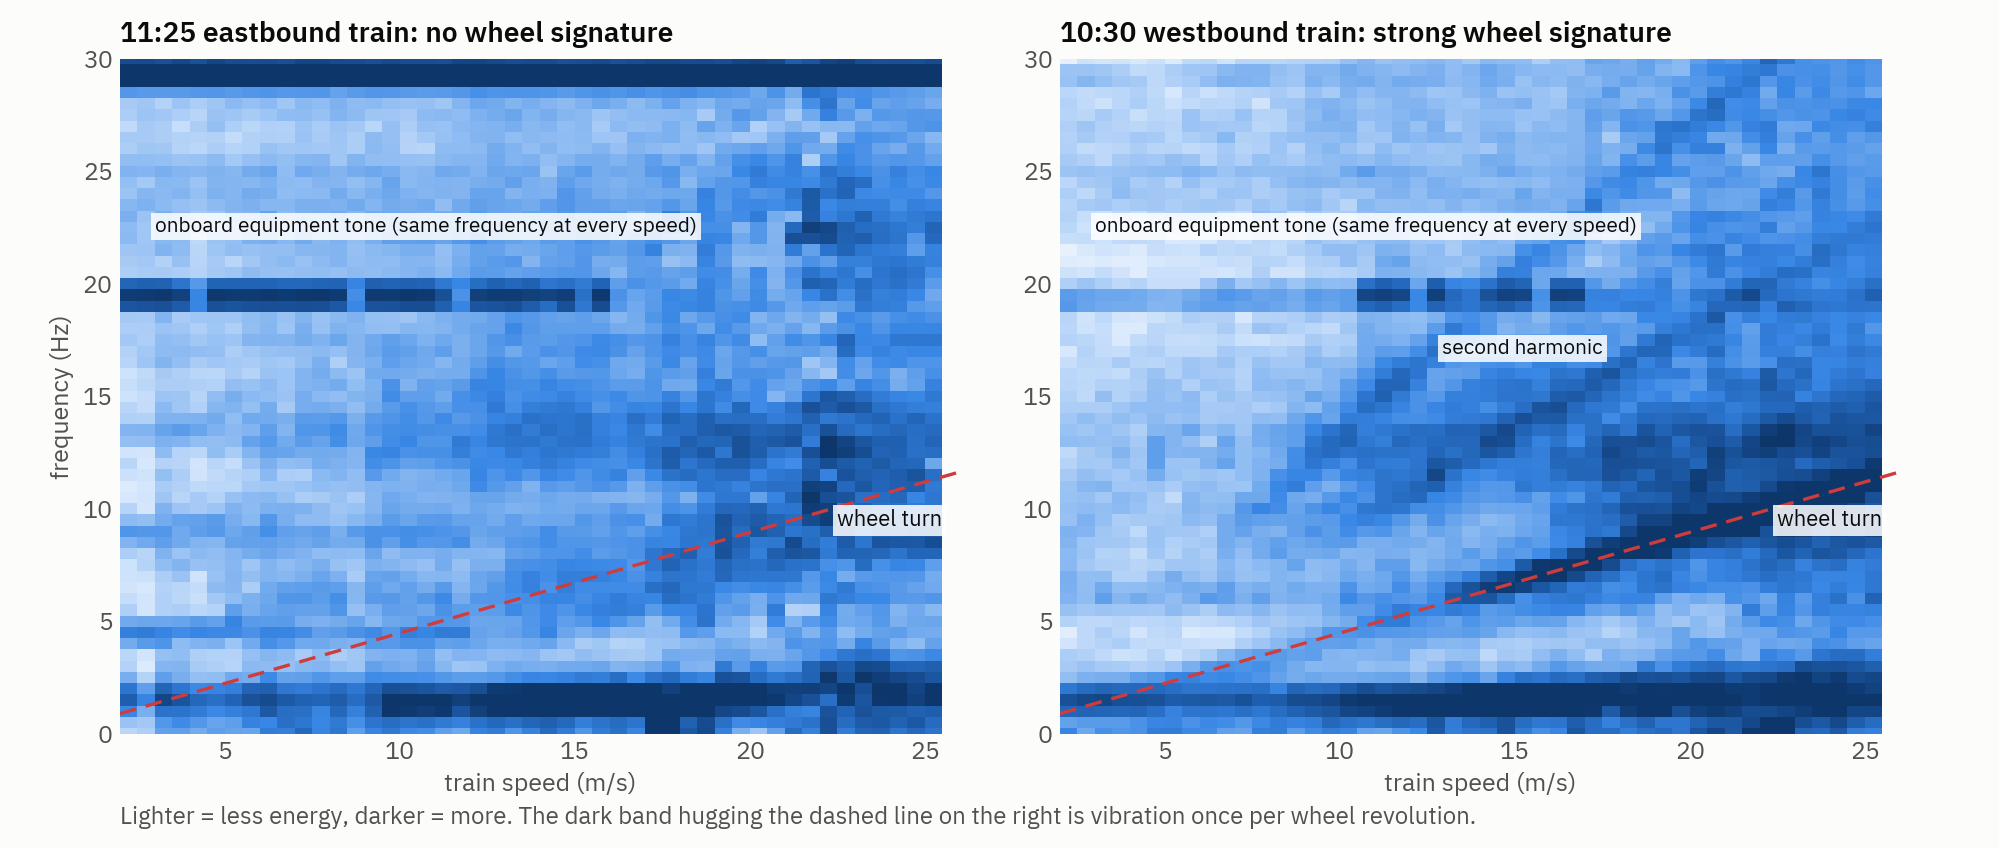
A stricter second pass used 13 recordings from 4 sensors on 6 trains: the 11 recordings behind the map, plus two from a 12:09 eastbound train. It places each train on LA Metro’s track map by combining the GPS of every sensor aboard, removes moments when a sensor was moved, corrects for braking, acceleration and wheel vibration, and scores every 20 m of track against normal track at the same speed. A zone counts only when independent trains agree. Each is tested against 3,000 random shifts of the data; zones with a false-discovery rate of 10% or less are confirmed, and the rest are probable.
| Zone | Status | Where | Track | Trains agreeing | q | Repair order | On our map | Street View |
|---|---|---|---|---|---|---|---|---|
| Loading zones… | ||||||||
q is the chance that a zone this strong is a fluke, after testing every 20 m of track; confirmed means q ≤ 0.10. Repair order weighs that evidence by riders affected, train speed and nearby ramps. “On our map” lists the map’s spots within 50 m of the zone, about the size of the position uncertainty; select one to see it on the map. Download the zone table (CSV)
How it compares with the map
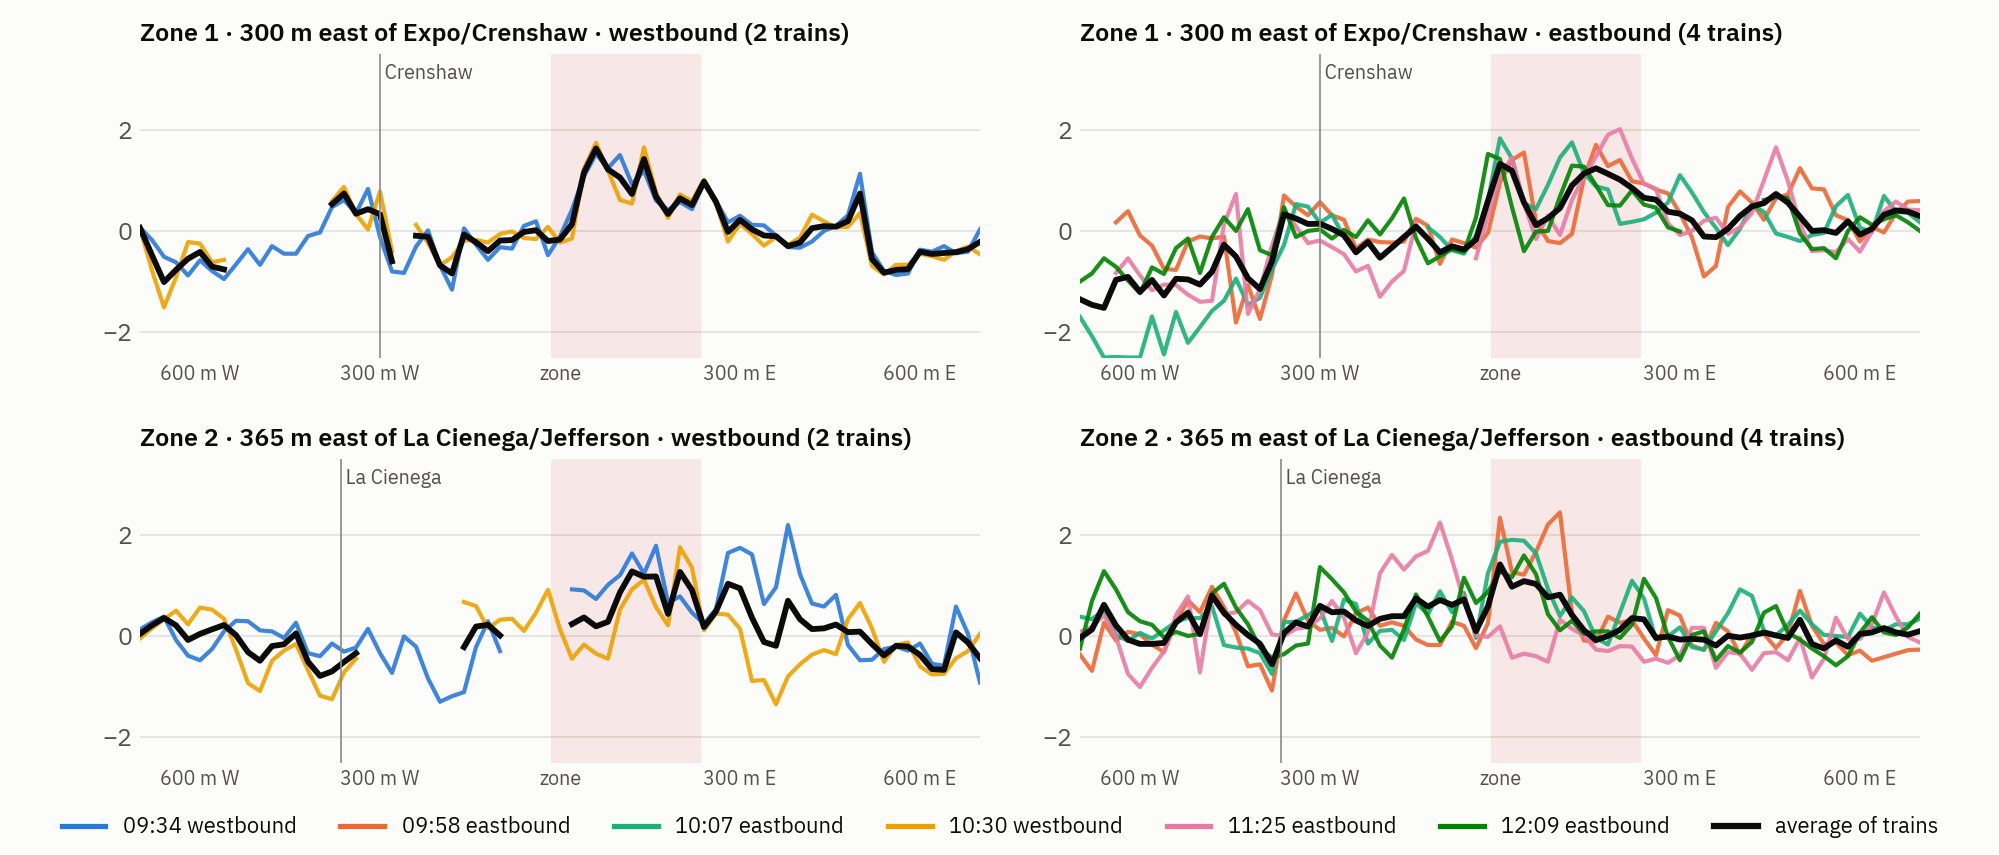
Where they overlap, the two analyses agree. Confirmed zones 2 and 3 and probable zones 4 and 7 sit on spots the map already flags, and zone 4 holds the map’s roughest spot, WB-01. Zone 5 lines up with WB-05, but on the other track. Confirmed zone 1, 300 m east of Expo/Crenshaw, is not on the map. The map’s screen keeps only steady-speed stretches, and in most of this zone’s 25 m slices only one pass had them, short of its two-pass rule; where two westbound passes did, neither reached that pass’s top 10%. The second analysis corrects for braking and acceleration instead of dropping them, and adds the 12:09 train. Zone 6, at Farmdale station, is also new.
Where the ride is consistently rough, on each track
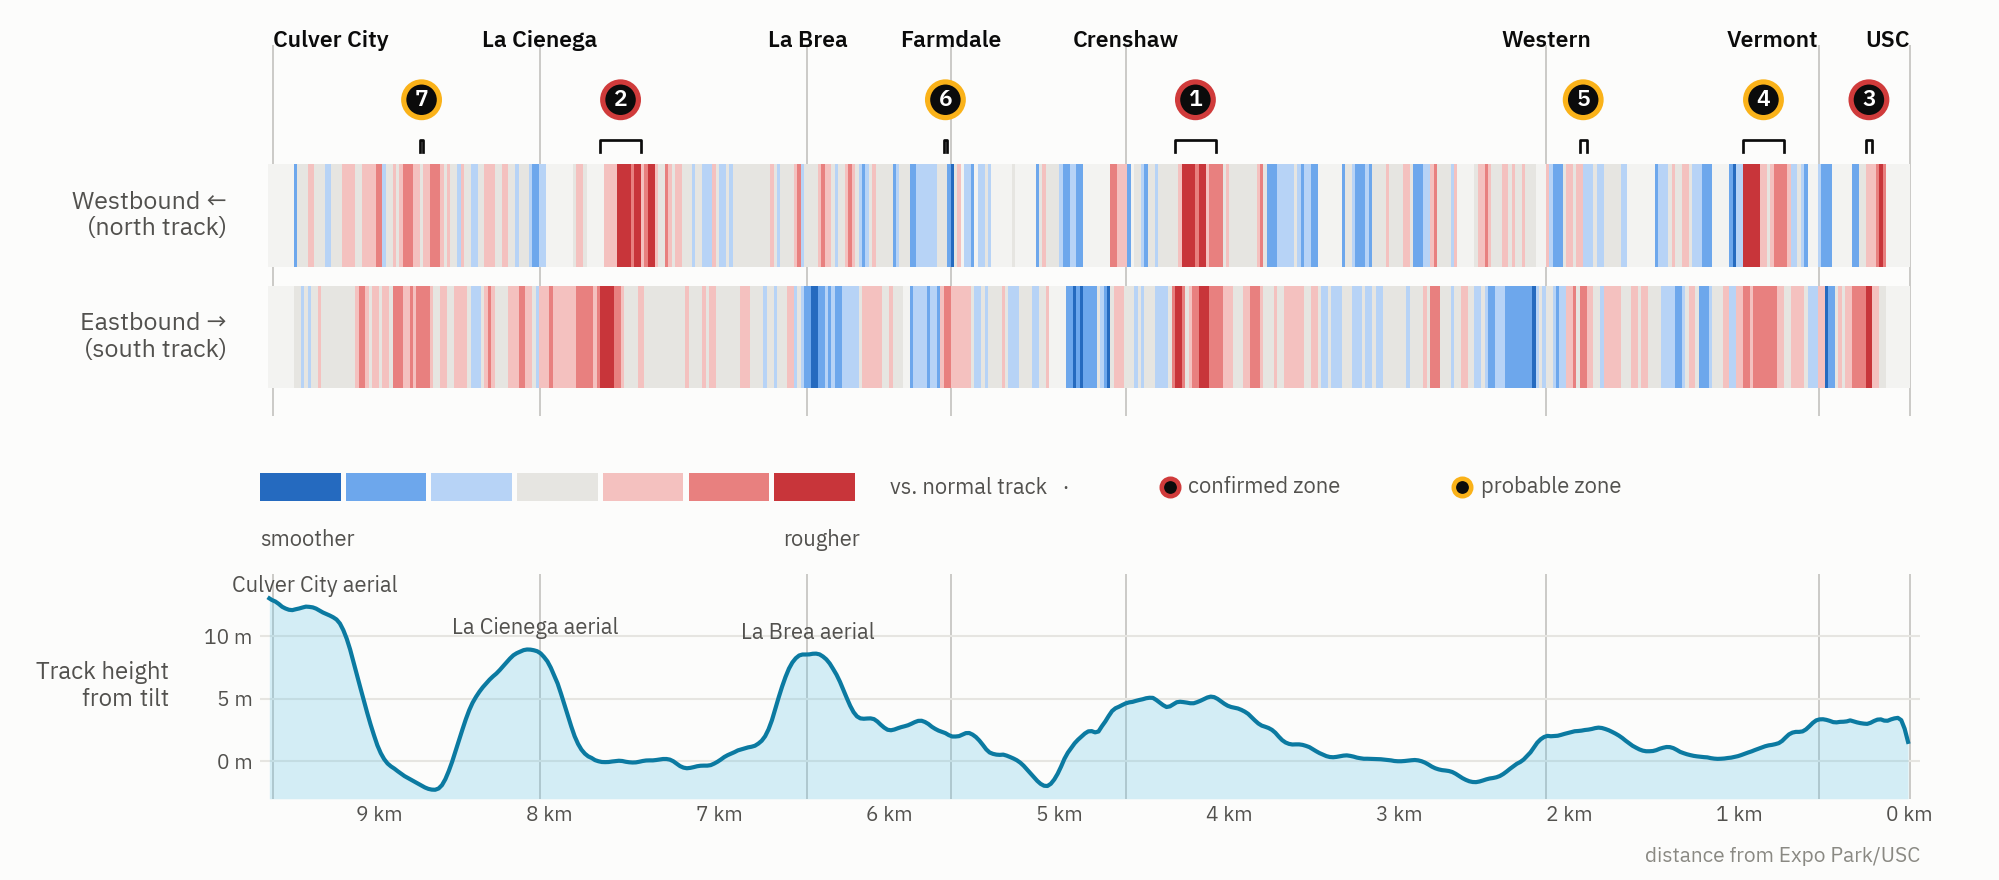
Independent trains agree at the two confirmed zones
On one train, the vibration tracks wheel rotation exactly
Figures: 13 sensor recordings on the LA Metro E Line, 26 Sep 2026; LA Metro GTFS track geometry. This is one morning of data, with only 2 westbound trains and no E Line ground truth yet, so every zone is an inspection candidate. The code, outputs and all 16 figures are in the Pinetrack Zone Analysis folder.
Learning from real defects: the Beijing Subway dataset
Our E Line recordings have no answers attached yet: no inspection report tells us what is actually at each spot. The one dataset in this project that does is a public Beijing Subway set of car-body vibration recordings matched to inspection reports that mark where real track defects were (Wang et al., CC-BY). We used it in a supporting role: to test our assumptions and to add one input to each zone’s evidence rating. It never decides a zone on its own.
How it helped
- It showed the approach can work. A model trained on Beijing’s labeled recordings, using only the signals our sensor records, told defects apart from normal track with an AUC of 0.95, where 1.0 is perfect and 0.5 is guessing. At a 5% false-alarm rate it caught 97% of severe defects and 80% of all defects, so the dangerous problems stand out most.
- It adds a defect-likeness score. The model scored every 20 m of the E Line by how closely the vibration resembles Beijing’s confirmed defects. That score is 30% of each zone’s evidence rating; the other 70% comes from trains agreeing with each other.
- It lifted zone 4. About 400 m west of Expo/Vermont, zone 4 has the strongest model score of any zone, 86%. On repeat trains alone it is only probable, because just 2 of 4 trains agree so far. The model is why it ranks third on the repair list, ahead of confirmed zone 3.
- It cross-checked the confirmed zones. Without any tuning to E Line data, the model put confirmed zones 1 and 2 in the top 1.5% of the line and zone 3 in the top 7%. Two different methods pointing at the same places is stronger than either alone. Its single highest score, 87%, is on the westbound track about 470 m west of Expo/Western, where the map flags WB-06; only one train covered that stretch, so the repeat-train test could not check it yet.
- It backed two design choices. Vertical shaking was the strongest defect signal in Beijing (vertical alone: AUC 0.90), so the analysis leans on vertical vibration. And Beijing’s defects tended to show up at lower train speeds, so an uncorrected model could “find” defects just by noticing a slow train. That is why every stretch is compared only with stretches at a similar speed.
What it can’t do. It can’t tell what is actually at any E Line spot: different trains, sensors and track mean its scores rank spots rather than give real odds. And it isn’t fully independent of the repeat-train test, since both use related vibration measures, so it is strong corroboration, not proof.
Next: training on LA Metro’s own data
Beijing is a head start, not the answer. Once Pinetrack sensors ride LA Metro trains every day and Metro shares its track inspection and repair records, every alert will end with a real answer: the inspector’s “issue found” or “nothing found”, and Metro’s record of what was fixed. Those answers become E Line labels. We will retrain the model on them, so its scores come from the E Line’s own track instead of a comparison with Beijing, and tune the alert rule to flag problems earlier with fewer false alarms. More passes sharpen the repeat-train test too: with a stable baseline, we project that about 10 passes will confirm a new 0.6 m/s² jolt.